


Waiting for the Great American Realignment
The vibes have realigned. The voters, not so much.


I have a new piece out in Queer Majority going down the rabbit hole of online conspiracy theories about the magazine. Read it here.
Donald Trump’s surprise victory in 2016 changed American politics. To many, it signaled more than a mere shift, or even a new era, but a political realignment. According to this thinking, the Democrats, long the party of the poor, the disadvantaged, and minority groups, had become the party of wealthy elites and educated professionals. Similarly, the Republicans had moved on from their days representing big business and good old country club white folks to become a multi-racial working-class coalition. By 2022, this narrative was common in many political circles. By 2024, it was broadly accepted. Today, months after Trump’s comeback re-election, it’s essentially regarded as a truism. A Senate resolution stating that the sky is blue would fall along party lines, and yet Democrats, liberals, the mainstream media, conservative media, new media, foreign media, and Donald Trump himself all agree that there’s been a “historic realignment.”
But is it in fact true? I set out to answer this question in 2022, and again in 2023, each time finding that the evidence fell far short of the claim. However, after nearly two years, another presidential election, and the official mainstreaming of the realignment narrative, I knew it was time to revisit the subject. This time, in addition to incorporating the new election alongside more data sources, I’m expanding my examination by several dimensions to leave no stone unturned. So the question remains: has the long-proclaimed political realignment finally arrived?
A political realignment is defined as a “rare, significant, long-term change in the voting behavior and party identification of the electorate.” Since the Democrats and Republicans became the two dominant parties in 1856, there have been three widely recognized political realignments: first in the 1890s, second in the 1930s, and third in the 1960s-70s.1 Each time, the parties underwent profound and lasting sea changes in terms of their voter demographics, electoral appeal, and policy platforms. To determine whether the 2024 election constituted a political realignment, we’ll explore not only voting patterns by income, education, and race/ethnicity as before, but also union support, electoral geography, the urban/rural divide, ideology, voting history, and party identification. Alongside exit polling, we’ll also draw from the AP VoteCast survey, which some political scientists prefer because it does a better job of capturing data not just from election day, but also from early and mail-in voters.
[To keep the text from being overly cluttered with hyperlinks, I’ve gathered exit poll data from 1972-2024, including midterm elections, as well as the 2020 and 2024 AP VoteCast surveys, in a single footnote below.2]
Are Voters Switching Sides En Masse?
One the clearest signs of a political realignment is when voters switch places in droves. Three measurements give a good indication of this: party affiliation, political ideology, and who voters cast their ballots for in the previous election.
Self-identified Democrats and self-identified Republicans have voted for their own respective parties in huge majorities going back more than 40 years, even in landslide elections. In 2024, exit polls found that 95 percent of Democrats or Dem-leaning voters went for Kamala Harris, and 94 percent of Republicans or Republican-leaning voters chose Donald Trump. VoteCast found similar results, with 95 percent of Dems voting blue and 92 percent of Republicans voting red.
Similarly, self-identified liberals3 have voted overwhelmingly Democratic for generations, as self-identified conservatives have voted Republican. In 2024, exit polls had 91 percent of liberals voting blue and 90 percent of conservatives voting red. VoteCast broke these groups into smaller categories, with 88 percent of “somewhat liberal” and “very liberal” voters going for Harris, and 86 percent of “somewhat conservative” and 92 percent of “very conservative” voters choosing Trump.
By voting history, we again see a continuation of the same pattern. For decades, Americans who vote for a particular party typically vote for the same party in the next election by vast margins. If anything, there’s less movement in recent years than there used to be. For example, only 59 percent of the people who voted Republican in 1988 did so in 1992. We don’t see those kinds of swings anymore. 93 percent of Biden 2020 voters cast their ballots for Harris in 2024, and 95 percent of Trump 2020 voters did so again four years later. Whether measured by party affiliation, ideology, or voting history, there’s no evidence that significant numbers of people are switching ideological or partisan sides.
Voting Patterns by Income
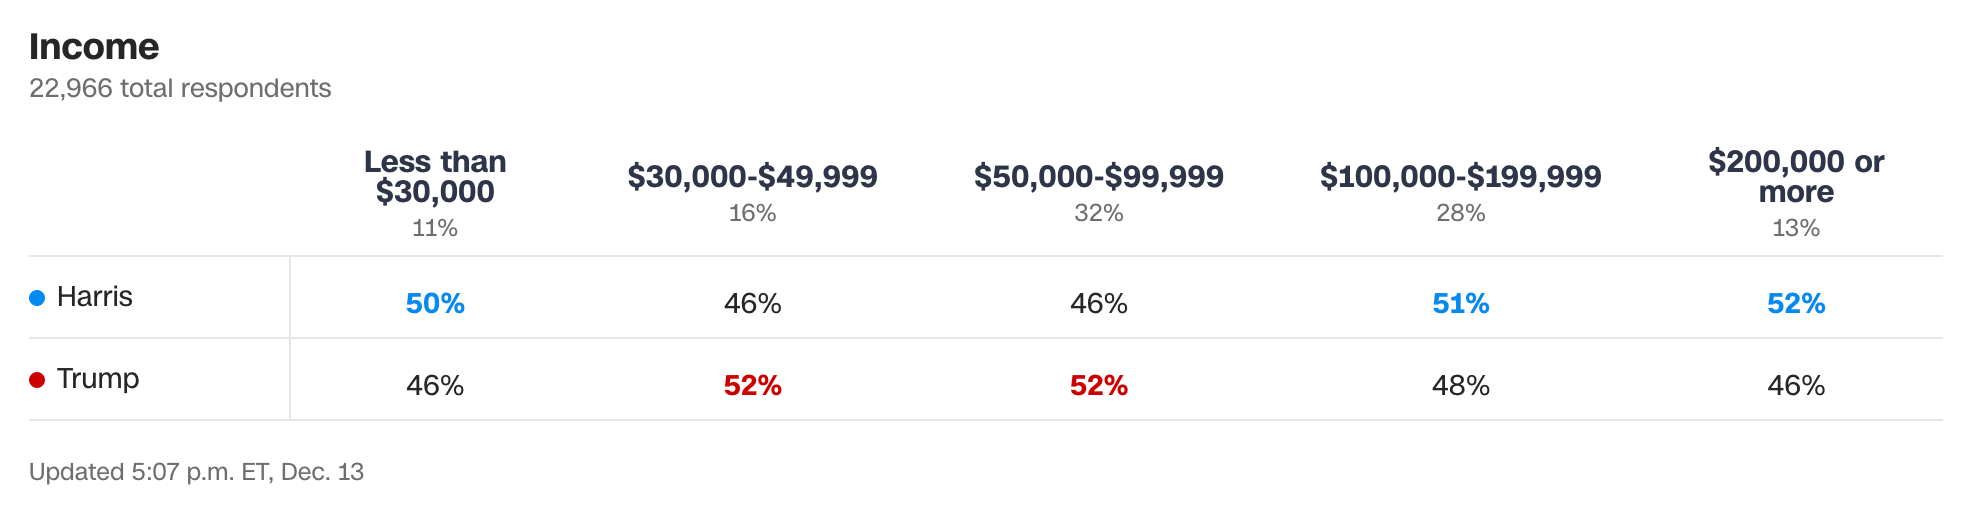
Voter income demographics can help give us a sense of whether the socioeconomics of the political landscape are shifting. Income is generally broken into five tiers: under $30,000 per year, $30,000-$50,000, $50,000-$100,000, $100,000-$200,000, and $200,000 or more. Historically, Democrats have dominated the bottom two brackets, with the Republicans dominating the top two, and the middle mostly up for grabs and usually going to the winner. Notably, in 2016, the two parties tied in support among the $100K-$200K cohort, and in both 2016 and 2020, tied among voters with household income over $200K.
In 2024, we saw a real change.
For the first time on record, the Democrats won the top two income tiers, with 51 percent of voters making $100K-200K and 52 percent of voters making over $200K. The only other Democrat to come close was Barack Obama in 2008, who won the top income tier but not the top two. The Republicans also won the $30K-50K cohort for the first time since the 1998 midterms. Remarkably, the Dems retained their control of the lowest income bracket, winning voters making less than $30K as they have for many decades.
This demonstrates a striking shift on the economic axis, though not a clean one. While the wealthiest two income tiers turning blue bolsters the narrative that the Democrats are becoming the party of the elites and the Republicans the party of the working class, the fact that the Dems have held onto the poorest voters complicates matters. After all, what does it mean to be the party of both the rich and the poor? As intriguing as these developments are, we’ll need to see what happens in 2026 to ascertain whether this was the beginning of a new direction or an aberration.
Voting Patterns by Education
Education is an area in which there has been an unambiguous shift. For decades until the mid-2010s, voters with only high school diplomas reliably voted for Democrats, those with some college (including two-year degrees) bounced back and forth, college graduates went mostly for Republicans, and postgrads voted for Democrats. This began to change in 2014, when Republicans won high school and college grads, and continued in 2016, when they won high school graduates while the Dems won the college crowd. In every election since, presidential and midterm alike, including 2024, this pattern has proven durable. The transformation in educational demographics is real. The Democrats used to be the party of both the least and most educated, and the Republicans used to be the party of the moderately educated. Today, the landscape is more clear-cut: the Dems are the party of the educated and the GOP are the party of the less educated.
Labor Unions
Labor unions are another proxy for working-class support, and union members have been a key part of the Democratic Party coalition since the New Deal era of the 1930s. As far back as I could trace the available data (from 1976 on) Democrats have won the union vote in each and every election. 2024 is no different. Exit polling found that Harris won 53 percent of union households, and VoteCast showed Dems winning 57 percent of union members, and 50 percent (to Trump’s 49) of people who live in the same household as a union member. There may have been some shifts in income and education, but organized labor remains Team Blue.
Race and Ethnicity
Since as early as the available data goes (1972), the GOP has lost the white vote only once, in the 1982 midterms. Over this span, the Democrats have a perfect record winning the black and Latino/Hispanic vote. The racial/ethnic voting gaps have narrowed over the past few cycles, but this trend remains intact. In 2024, exit polling and VoteCast found the GOP won the white vote with 57 and 56 percent, respectively. Similarly, Dems won black voters with 86 and 83 percent, Latino voters with 51 and 55 percent, and Asian voters with 55 percent.
Much has been made in the media about Kamala Harris’s underperformance and Donald Trump’s overperformance with minority men as well as Muslim voters, but the data paints a far less sensational picture. Exit polls have Harris winning black men with 77 percent, and VoteCast with 74 percent, and Latina women with 58 and 59 percent, respectively. As for Trump’s widely reported victory among Latino men, this result only shows up in exit polling, where Trump won 54 percent, not in the VoteCast survey, where Harris won 50 percent to Trump’s 48.

Muslim voters were measured only by VoteCast as well as a lower-quality survey conducted by the Muslim activist group CAIR. The CAIR survey found that 53 percent of American Muslims voted for the Green Party, an absurd finding suggesting CAIR’s respondents were drawn heavily from very progressive voters rather than a representative sample.4 VoteCast, by contrast, found that 62 percent of Muslim voters cast their ballots for Harris and six percent voted third party (a far more believable result).
Taken as a whole, there’s some movement here, particularly among Latino men, but the narratives around Republicans becoming the multi-racial party are mostly sensationalist clickbait.
The Urban/Rural Divide
The realignment narrative is largely a socioeconomic one, in which the Democrats have become the party of the elites and the Republicans the party of the “people.” In geographic terms, this ties in with the longstanding but erroneous idea that urban areas are signifiers of the elite and rural areas are indicative of the “real America.” Never mind the fact that 80 percent of Americans live in urban areas and have done so for decades, this is one of those “personal truths” allowed rural Americans and their right-populist urbanite cheerleaders despite its numerical absurdity. What’s interesting is that urban/rural voting patterns both confirm the right-populist framing of the parties while utterly repudiating any notion of a political realignment.
Since at least the early 1970s, Republicans have dominated in rural areas and small towns, and Democrats have been virtually unbeatable in big cities. Suburbs went Republican more often than not in the 20th century, but in the 21st, they’ve gone back and forth — typically to the victor. 2024 was nothing new, with Harris mopping up the urban vote, Trump handily carrying rural areas and small towns, and the suburbs showing a much closer contest. Exit polls had Trump winning the suburbs with 51 percent of the vote; VoteCast showed Harris winning with 52 percent. In this instance, the exit polls seem more accurate, given Trump’s electoral and popular vote victory. So, if we are to suppose the urban/rural divide holds some populist significance, then yes, the Dems are the party of the elite — but if these voting patterns have been steady for over 50 years, that’s rather inconvenient for anyone proposing a realignment.
The Electoral Map
The electoral map is the crudest tool in our realignment-detection kit, as it tells us so little about demographics, but it’s also the most indicative. As I wrote in 2023:
“Past realignments were not subtle. They did not require careful parsing of certain fine-grained trends to tease them out. They showed up in profound and indisputable ways at the national level.”
The most recent of which is also the most visually stunning:
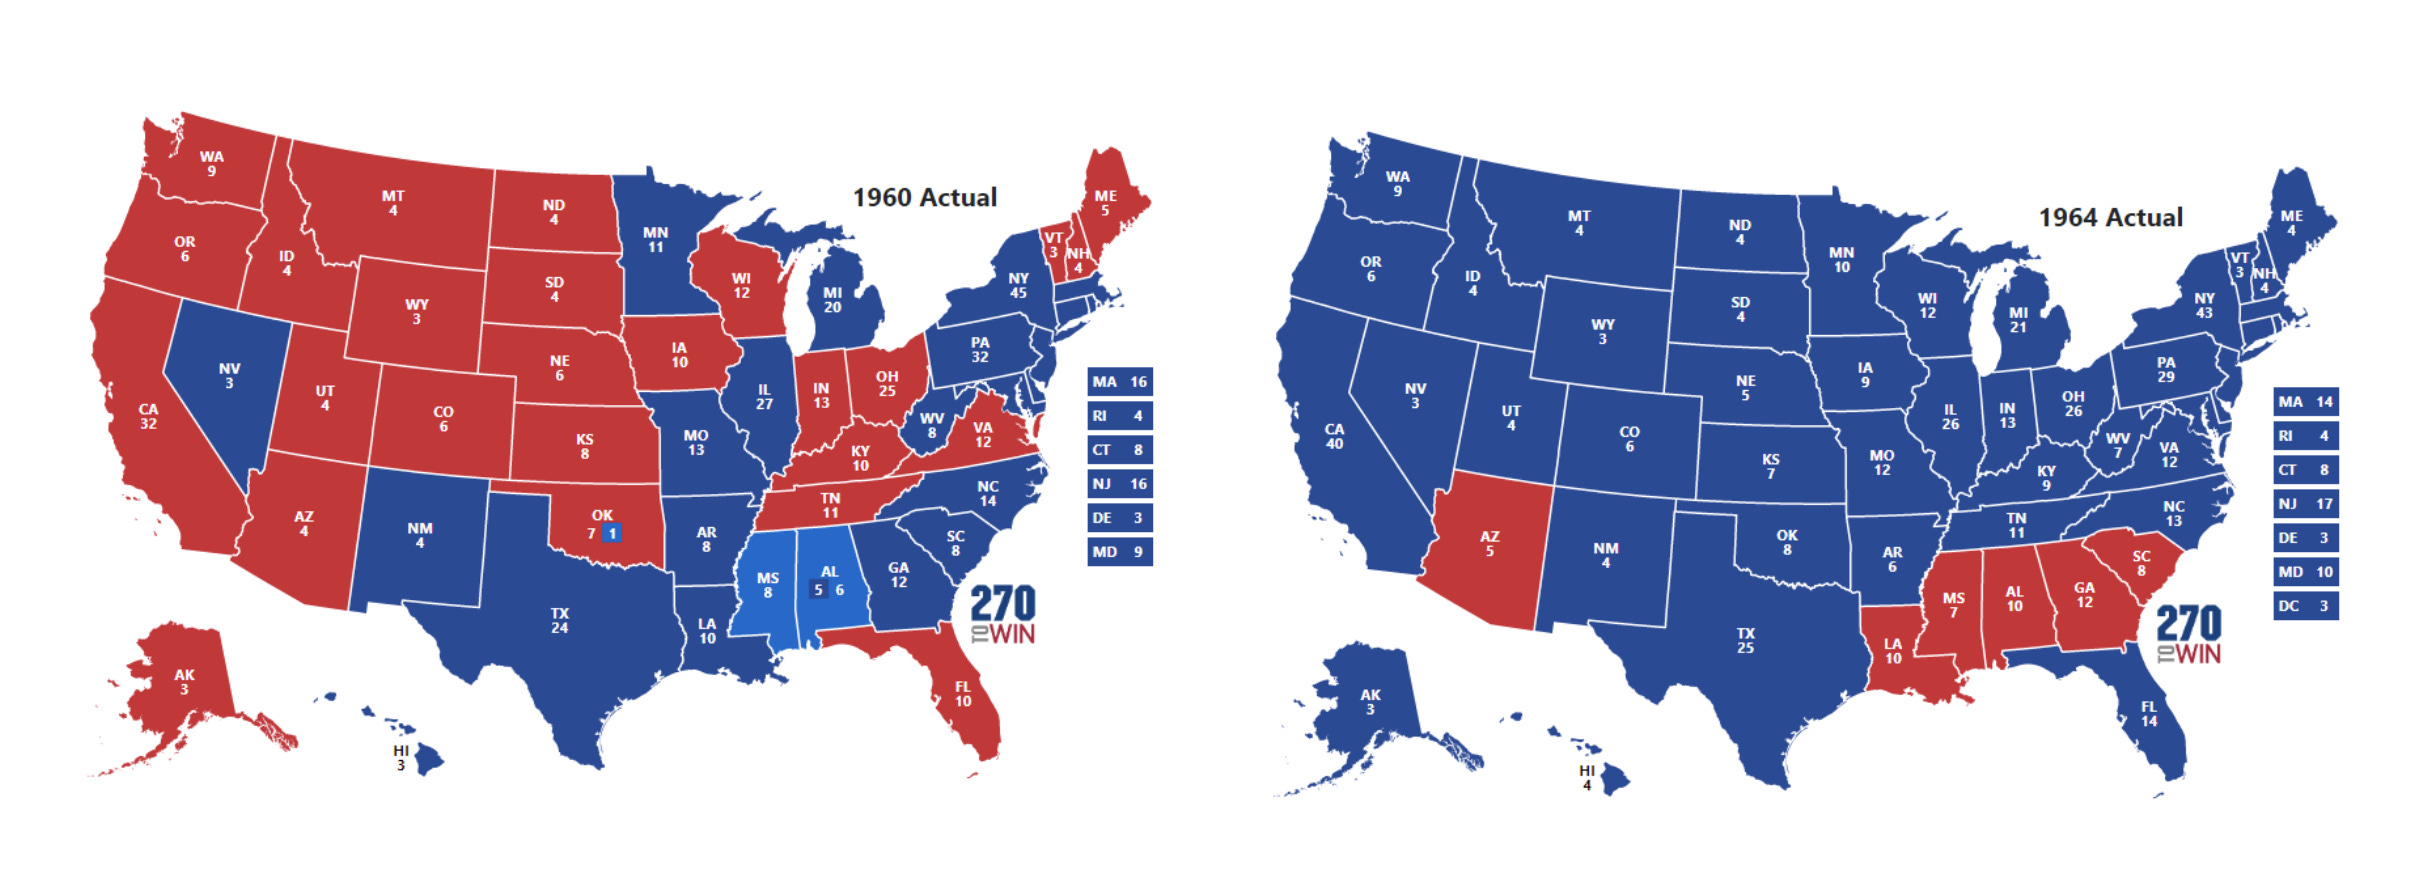
If the crudest measurement doesn’t show a shift immediately noticeable to a casual observer, the term “realignment” generally doesn’t apply. Show a small child the 1960 map alongside the 1964 map, and she will see the difference — no statisticians required. By contrast, here are the past 25 years of electoral maps:
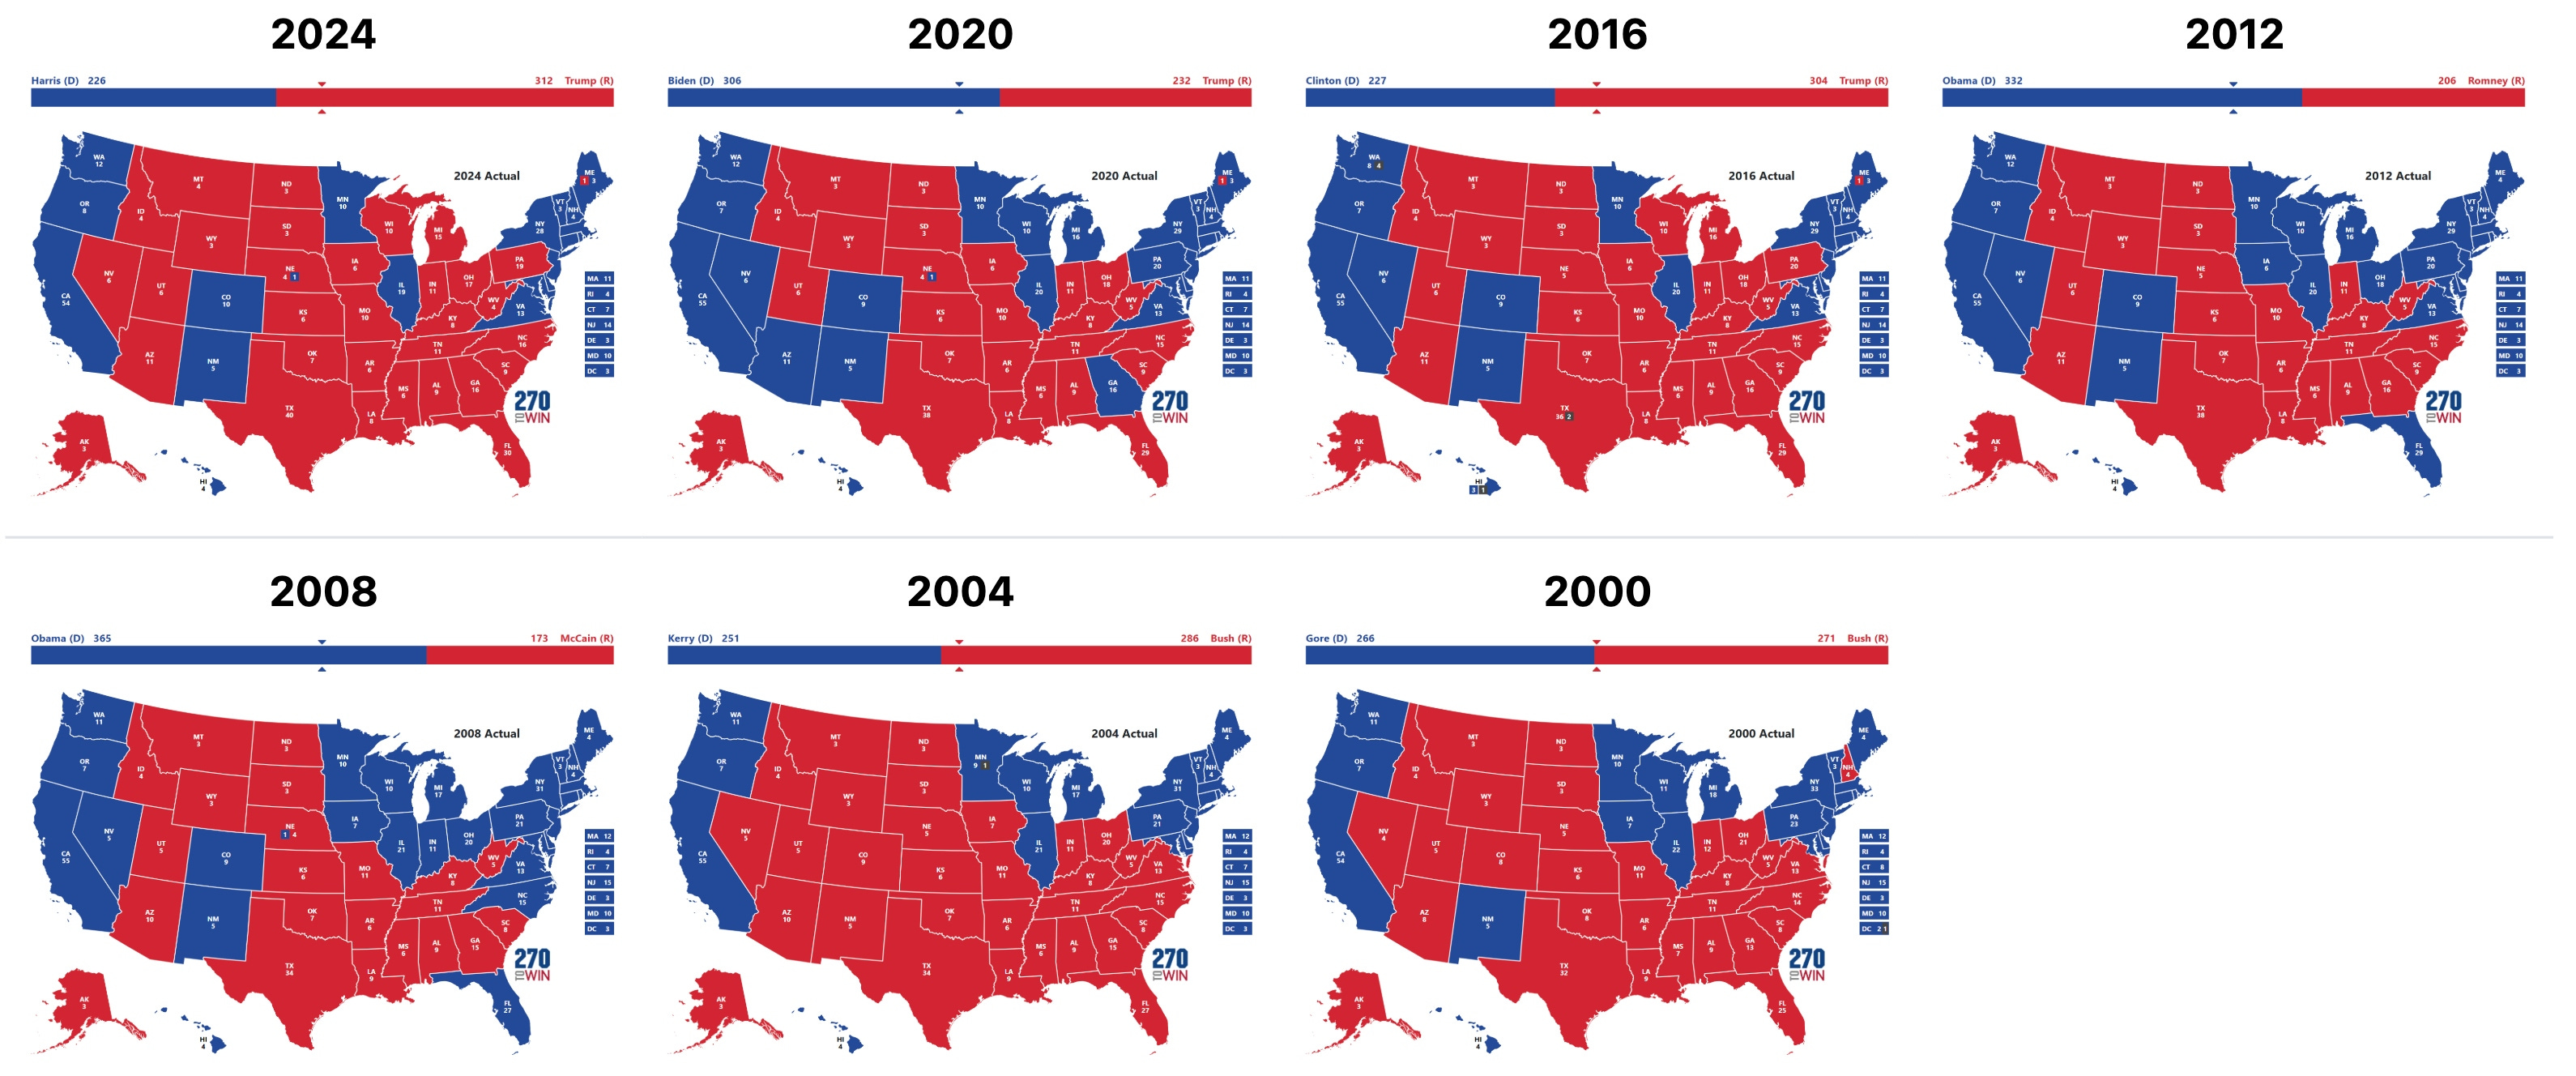
As we can see, the geographic distribution of red and blue states has remained mostly stable for the past quarter century. The Democratic strongholds are in the Northeast and the West Coast, the GOP’s home turf is the South and most of the frontier states, and the two battle it out among a shifting handful of swing states. Realignment elections not only show huge numbers of states flipping from one party to the other, they nearly always indicate landslides as well. “Landslide” is another term pundits are fond of overusing, but we haven’t seen a true landslide since 1984 when Ronald Reagan trounced Walter Mondale by more than 18 points in the popular vote, winning 49 states. Poor Mondale only carried is native Minnesota as well as Washington DC. Trump, by contrast, won the 2024 popular vote by 1.5 points, the slimmest margin since the infamously close 2000 race. Trump also did so with a plurality, not an outright majority, winning 49.9 percent of the vote. US politics have become too polarized and too close to allow for anything recognizably similar to past realignments.
The Verdict?
Of the nine realignment proxies I examined, seven — party affiliation, ideology, voting history, labor union support, the urban/rural divide, and electoral geography — showed no significant change from past election cycles. On the other two — income and education — we’ve seen shifts. On education in particular, we have seen a durable shift among college-educated voters toward the Democrats and non-college voters toward the GOP. It begun in 2014, culminated in 2016, and has held steady ever since. On race/ethnicity, we have seen some movement among Latino voters, and specifically Latino men, drifting away from the Dems and toward the Republicans, though not as dramatically as media reporting and commentary may lead us to believe. Considering these metrics in totality, then, while some variables are shifting — as they always do — we still aren’t seeing a realignment as traditionally understood (e.g. 1964).
The Trump Effect
With the dawn of the Trump era in 2016, the current realignment narrative was born. And during the Trump era, there have been two midterm election cycles so far. In each one, something fascinating has transpired. When Trump is on the ballot, in 2016, 2020, and 2024, we see the GOP underperform with the wealthy, and the Democrats lose ground with working-class voters. Yet in the midterm elections of 2018 and 2022, these trends reverted quite neatly to pre-Trump voting patterns. In other words, this “Trump effect” scrambles some of the usual dynamics when Trump’s name is on the ballot, but in the elections in which Trump isn’t running, the electorate votes almost as though the year were 2014.
Given this phenomenon, several questions remain to be answered. Will we see the same reversion to pre-Trump voting patterns in the 2026 midterms? What will we see in 2028, when Donald Trump is (presumably) not on the ballot? The overarching question is whether the changes we’ve seen are truly long-term shifts or primarily the bizarre effects of a singular political figure with a unique ability to appeal or repel certain parts of the electorate? So far, the Trump effect suggests the latter, but there are many people deeply invested in these changes representing a political realignment.
Vibes Are Not Reality
Ezra Klein asked in The New York Times, “Trump barely won the popular vote. Why doesn’t it feel that way?” The answer is twofold. In part, it’s a product of the colossal double standard at the heart of American politics, in which so little is expected of Republicans that things like basic decorum or actually winning more votes than their opponent are heralded as monumental achievements. But mostly, it’s just “vibes.” As Klein wrote, “Trump’s cultural victory has lapped his political victory. The election was close, but the vibes have been a rout.”
The Democratic Party’s disarray, the inevitable backlash against critical social justice, and the transformation of Twitter from the cultural left’s online cathedral to the great digital sewer of right-wing culture wars have indeed shifted the “vibes.” The left stands visibly demoralized while the right is as loudly ascendent as it’s been in decades. This is what most people are seeing. They’re not reading through datasets or doing research, for all the lip service given to “doing your own research.” It feels like something profound has changed in society. And while “wokeness” has been repudiated, postmodernism has gone mainstream — on the left, right, and center alike, feelings and “lived experience” are sacrosanct.
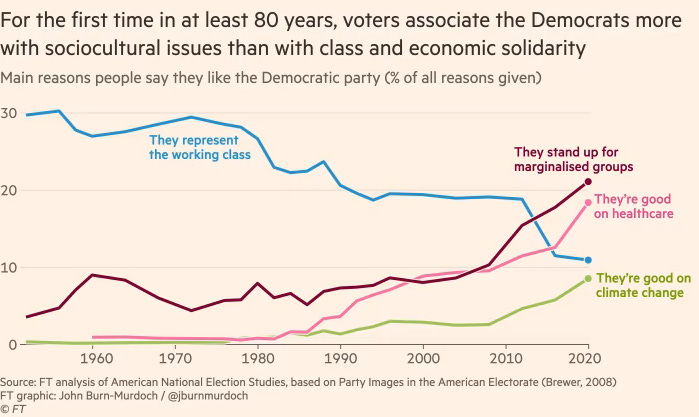
Even though these feelings are not necessarily informed by data, they themselves are captured by it. Voters once associated the Democrats as, first and foremost, a party representing the working class. Polls now show they are primarily seen as “standing up for marginalized groups.”
This realignment of public perception has been helped along by a number of factors. For one, the discourse about a political realignment has been permeating society for a decade at this point. More recently, most of the reporting about the 2024 election results occurred within a few days of the vote, when only preliminary exit poll data was available. As is always the case, orders of magnitude more people see the most grandiose initial claims, and only a tiny sliver see the more sober-minded corrections or refinements quietly released at a later date. Another issue is that almost every argument advancing the realignment narrative relies solely on data from presidential elections and does not take midterms into account. This is a glaring omission, one that not only discards half of all elections, but also completely misses the Trump effect.
Portions of the realignment narrative, such as GOP gains with working-class or minority voters, have also been misleadingly portrayed in a vacuum, when in context they seem quite different. In 2024, Trump increased his vote share in all 50 states and in 89 percent of counties compared to 2020. Even though Trump only narrowly won the popular vote by 1.5 points, he lost by 4.5 points in 2020, so 2024 represented a six-point swing, which accounts for these nearly across-the-board gains. To single out particular shifts within this swing obscures the larger picture: Republicans won the popular vote for the first time in 20 years, and only the second time in the past 35 years. We’ve grown so accustomed to the GOP either losing elections, or winning the electoral college while losing the popular vote, that we seem to have forgotten a basic statistical reality. A large jump in votes across the country generally translates across the demographics without necessarily indicating some specific resonance within a given group.
I’ve noticed over the years that the “heterodox”, “anti-woke”, and “politically homeless” crowds have a particularly acute impetus to push the realignment narrative. They have a tendency to conflate the notion of a political realignment with acknowledging the problems with the Democratic Party and the far left (two entities they also routinely conflate). In these circles, rejecting the realignment hypothesis is tantamount to being an out-of-touch, snobbish, Democratic Party hack who obstinately refuses to recognize the overreaches of social justice politics. To notice that the evidence for a realignment is lacking is to let the left off the hook. To them, the realignment narrative — the Democrats losing working-class voters and becoming the party of wealthy elites — is a well-deserved rebuke of the left, one that must be true because of how well-deserved it is.
Except, at every turn, the political right has matched the left’s madness and raised them a straitjacket. The past decade has been a race to the political bottom, and normies don’t like extremism, whichever camp it comes from, which is why elections remain so closely contested, and why most voters, rather than switching sides as in proper realignments, hold their nose and vote for the same team simply to thwart what they see as the greater evil across the aisle.
In January of 2022, I set out to explore the political realignment I thought was happening. Like many others, I’d heard it discussed so often, and with seemingly credible data to back it up, that I assumed it must be real. Then, during the research for that article, it became clear that no such realignment had transpired, and the piece shifted from a “how this happened” explainer to an exercise in myth-busting. When I revisited the subject in March 2023, I found nothing different. Alas, the third time has not proven the charm. If we, in keeping with the modern trend of exclusively communicating via superlatives, really want to say there has been an educational realignment within American politics, we can safely do so at this point. If we want to say there has been a broader socioeconomic realignment, we have to wait for 2026 and likely 2028 to determine if the income shifts hold. As for an overall US political realignment? It still hasn’t happened.
See also: “US Elections are Quite Secure, Actually”
Subscribe now and never miss a new post. You can also support the work on Patreon. Please consider sharing this article on your social networks, and hit the like button so more people can discover it. You can reach me at @AmericnDreaming on Twitter, @jamie-paul.bsky.social on Bluesky, or at AmericanDreaming08@Gmail.com.
In this context, pollsters use “liberal” to mean “left of center.”
Jill Stein of the Green Party garnered fewer than 900,000 votes in 2024.